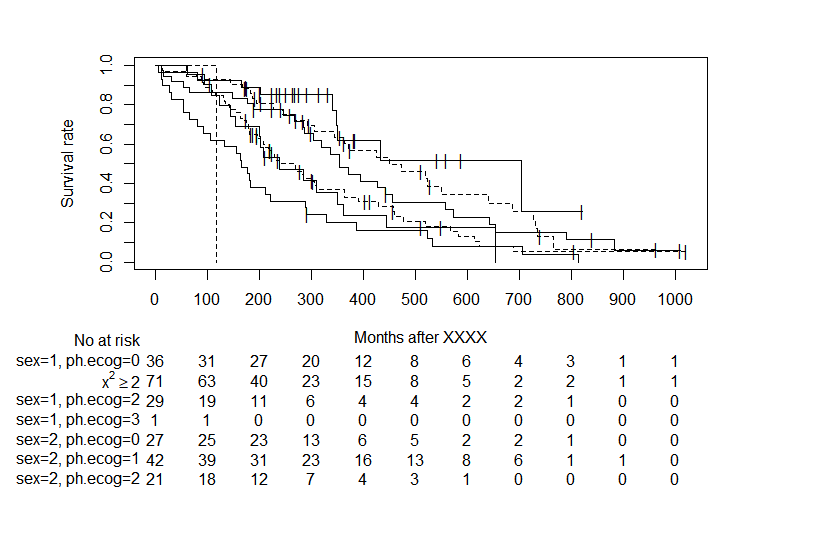
Rで生存曲線にNo at riskを書き入れる。自由に記号なども入れたい。パッケージ非依存。
かつての同僚から解析依頼があり、Kaplan-Meier 生存曲線にNo-at-riskを書き込む必要が生じた。
今の流行は
ggsurvplot()
ggkm()
などを使用する。お手軽にNo-at-risk入のグラフが作れる。
しかし、これだと数式なんかをグループ名に入れたいときに文字化けする。
No-at-riskなんてよく使うのに意外とググっても好きにいじれる関数が出てこない。
特に複雑なグラフでもないし、低水準な関数で書いてしまえということで作成。
ggなんちゃらのようにパッケージに依存しないのでカスタマイズしやすい。
これで無事に、グループ名にXの二乗とか>=とか自由に入れられる。
下にあるコードの中の
make_no_at_risk()を使えば、Sufvfitオブジェクトから
                  0 100 200 300 400 500 600 700 800 900 1000
sex=1, ph.ecog=0 36  31  27  20  12   8   6   4   3   1    1
sex=1, ph.ecog=1 71  63  40  23  15   8   5   2   2   1    1
sex=1, ph.ecog=2 29  19  11   6   4   4   2   2   1   0    0
sex=1, ph.ecog=3  1   1   0   0   0   0   0   0   0   0    0
sex=2, ph.ecog=0 27  25  23  13   6   5   2   2   1   0    0
sex=2, ph.ecog=1 42  39  31  23  16  13   8   6   1   1    0
sex=2, ph.ecog=2 21  18  12   7   4   3   1   0   0   0    0
というNo_at_riskの部分だけを自由な時間の組み合わせでmatrixで出力できます。これを使って各自自由に描画してもよし。
その後のNo_at_risk付きのKaplan-Meier plotは今回あえて関数にしてないけど(関数にするならggsurvplot使えばいいし)、ややこしいことはしていないので中身見て好きに変更していただければ幸いです。
logrankのP値なんかも単純なplotだし座標も見たままなのであとで好きに追加すると良いです。
library(survival)
dat <- survival::lung  #パッケージからデータ読み込み

sf1 <- survfit( Surv(time, status) ~  sex + ph.ecog , conf.type="log-log", conf.int=0.95,
                type="kaplan-meier", error="greenwood", data=dat)


make_no_at_risk <- function(sf1, times_x = NULL, times_n = 7, times_by = NULL,
                            time_name = "times"){

  if(!is.null(times_x)){
  }else if(!is.null(times_by)){
    times_x <- seq(0, max(sf1$time), by = times_by)
  }else{
    times_x <- seq(0, max(sf1$time), length.out = times_n + 1)
  }

  te <- sf1$strata
  names(te)
  length(sf1$strata)

  res <- matrix(0, nrow=length(sf1$strata), ncol = length(times_x))
  temp_name <-  as.character(unique(summary(sf1)$strata))
  rownames(res) <- temp_name
  colnames(res)  <- times_x
  for(i in 1:nrow(res)){
  res[i,] <- summary(sf1, times = times_x, extend = TRUE)$n.risk[summary(sf1, times = times_x, extend = TRUE)$strata == temp_name[i]]
}
  return(res)
}


oldpar <- par(no.readonly = TRUE)     # 現在のグラフィックスパラメータ値を退避する

nar1 <- make_no_at_risk(sf1, times_by = 100)

par(xpd=T) ## 枠外への描画を許可   余白へのtext描画許可
par(mar=c(8+nrow(nar1),7,3,6))  #下の余白を多めに
#rate_main <- 4
#mat <- matrix(rep(c(rep(1, rate_main), 2), 2), ncol=2, byrow = FALSE)
#layout(mat)
#par(oma = c(4, 0, 0, 0))


nar_grp1_y <- -0.5 #group1の描画位置
nar_delta_y <- 0.1 #groupの描画位置delta
nar_grp_x <- -10 #group左右方向位置

plot(sf1, conf.int = FALSE, mark.time = TRUE, lty = 1:2, xaxs = "r", mark = "|",
     xlab = "Days after XXXX", ylab = "Survival rate", yaxt="n", xaxt="n")
axis(side=2, at=seq(0, 1, by=0.1))
axis(side=1, at=as.numeric(colnames(nar1)))

erase_i <- 2 #expressionを使いたい群は消す
rownames(nar1)[erase_i] <- ""
text(0 + nar_grp_x, nar_grp1_y - nar_delta_y * (erase_i - 1) , expression(x^2>=2), pos=2) ##直接記載 ここがやりたかった!

for(i in 1:nrow(nar1)){
  text(0 + nar_grp_x, nar_grp1_y - nar_delta_y * (i - 1) , rownames(nar1)[i], pos=2)
}

for(i in 1:ncol(nar1)){
  for(j in 1:nrow(nar1)){
  text(as.numeric(colnames(nar1))[i], nar_grp1_y - nar_delta_y * (j - 1), nar1[j,i])
  }
}

text(nar_grp_x, nar_grp1_y + nar_delta_y,  "No at risk", pos=2)

par(oldpar)
